
How to Check Restaurant Competition in Your Area Before You Sign the Lease
Most people who open a restaurant in India pick the location the same way. They walk the street two or three times, once on a weekday and once on a Sunday evening. They count the signboards. They notice which places look busy. They ask the broker what the footfall is like, and the broker tells them it is very good.
Then they sign a five-year lease and spend somewhere between ₹25 and ₹60 lakh on fit-out, equipment and deposits, on the strength of two walks and a conversation.
The strange part is that a lot of the information they needed was sitting on Google the whole time. Every competitor in that catchment has a public listing with a rating, a review count, a category, a price level and an address. Nobody assembles it, because assembling it by hand for ninety-odd venues takes a full day and most people don't know it's worth doing.
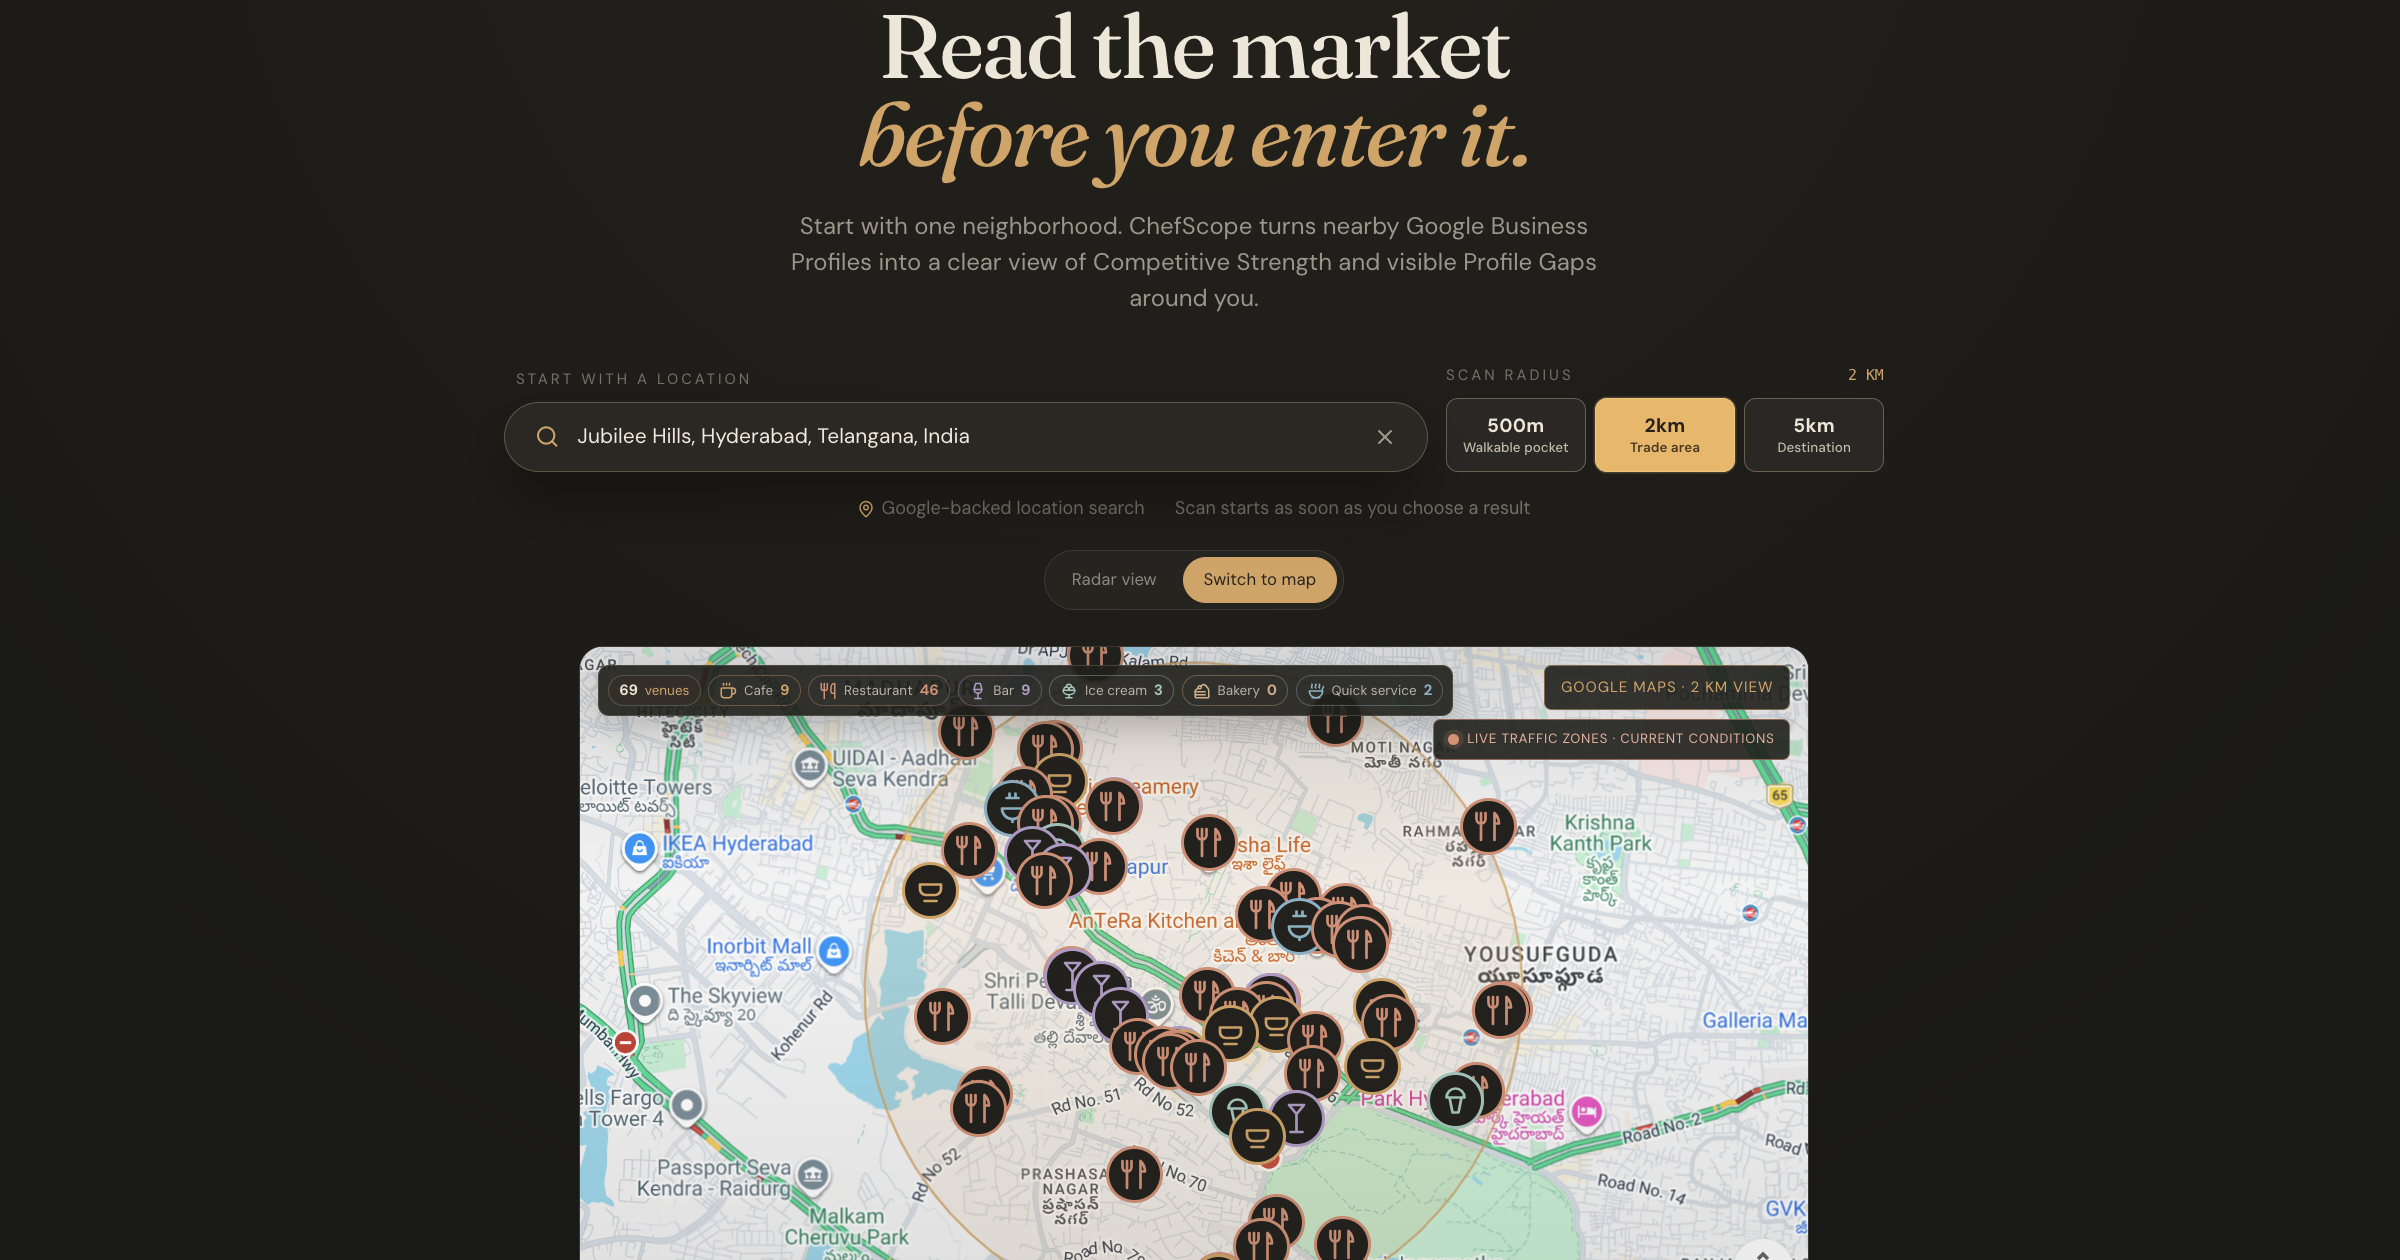
That's the gap ChefScope fills. You give it an area and a radius. It returns every food business Google can see inside that circle, ranked by how strong they actually are, along with where the competition clusters and where the listings are thin.
What ChefScope does, and what it doesn't
Worth being clear about this before anything else, because the category is full of tools that promise more than their data supports.
ChefScope reads Google. Places listings and Google Business Profile signals, captured live at the moment you run the scan. Ratings, review volumes, categories, price levels, business status, addresses, coordinates.
ChefScope does not measure footfall. It cannot tell you how many people walk past a door, how many cars pass the junction, or how many covers a competitor turns on a Saturday. Nobody selling you a ₹1,000 report can tell you that either. When a report gives you a "daily footfall" number for a street in Kukatpally, ask where it came from.
What the tool gives you is a fast, structured read of the competitive and commercial environment — enough to kill a bad site quickly, or to narrow three candidate sites down to one worth visiting properly. It is a filter before diligence, not a replacement for it.
What you actually get out of it
You see the whole competitive set, not the visible one. Walking a street shows you what's on the main road at eye level. A 2 km scan of Kukatpally returns 94 food businesses, including the ones on side lanes, inside malls, on first floors, and the delivery-led kitchens with no signboard at all. The set is always bigger than people expect.
You find out who's actually strong. A 4.9 rating from 40 reviews and a 4.2 from 29,000 are not comparable, but a star count on Google Maps makes them look it. ChefScope applies a Bayesian adjustment that pulls thin-review ratings toward the local average, so an established venue with thousands of reviews ranks above a new one with a handful of glowing ones. That reordering is usually the first genuine surprise in a report.
You see where the pressure sits. Competitors aren't spread evenly. They cluster around office blocks, around residential density, around whatever pulls people to a spot. The cluster view shows you which pockets are already saturated and which have context signals but thin supply.
You get a defensible document. If you're raising money, negotiating rent, or convincing a partner, a dated report with a stated method and disclosed limitations does more work than an opinion. Landlords and lenders respond differently to evidence.
It takes minutes. The same exercise by hand is a day's work, and you'd stop at thirty venues because you'd get tired.
How to run a scan
1. Enter your area. A locality name works — "Kukatpally, Hyderabad" or "Balanagar, Hyderabad." You can also drop a pin on a specific address if you already have a site in mind.

2. Set your radius. Use 1 km for a dense high street where people walk to you. Use 2 km for a suburban or arterial location where they drive. Bigger is not better — a 5 km radius in a dense city returns a competitive set nobody actually competes with you.
3. Pick your format. Restaurant, cafe, QSR, bakery, ice cream, sweets, bar, food court. This shapes how the results get read.
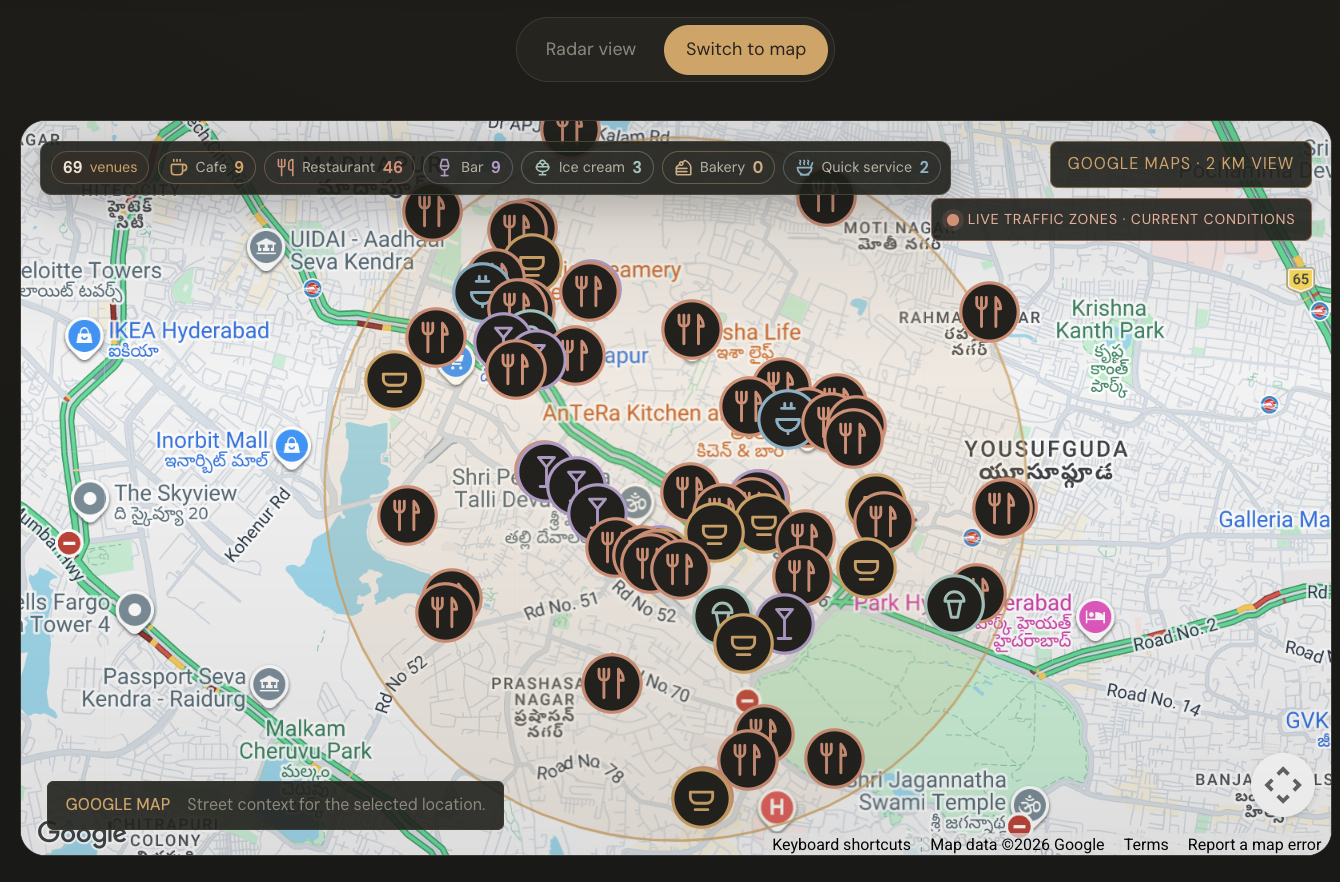
4. Run it, then read it twice. Once for the headline numbers, once for the competitor table. The table is where the useful detail is.
If you're comparing sites, run the same radius on each. Changing radius between scans makes the numbers incomparable, and it's the easiest mistake to make.
Understanding your report
The executive read
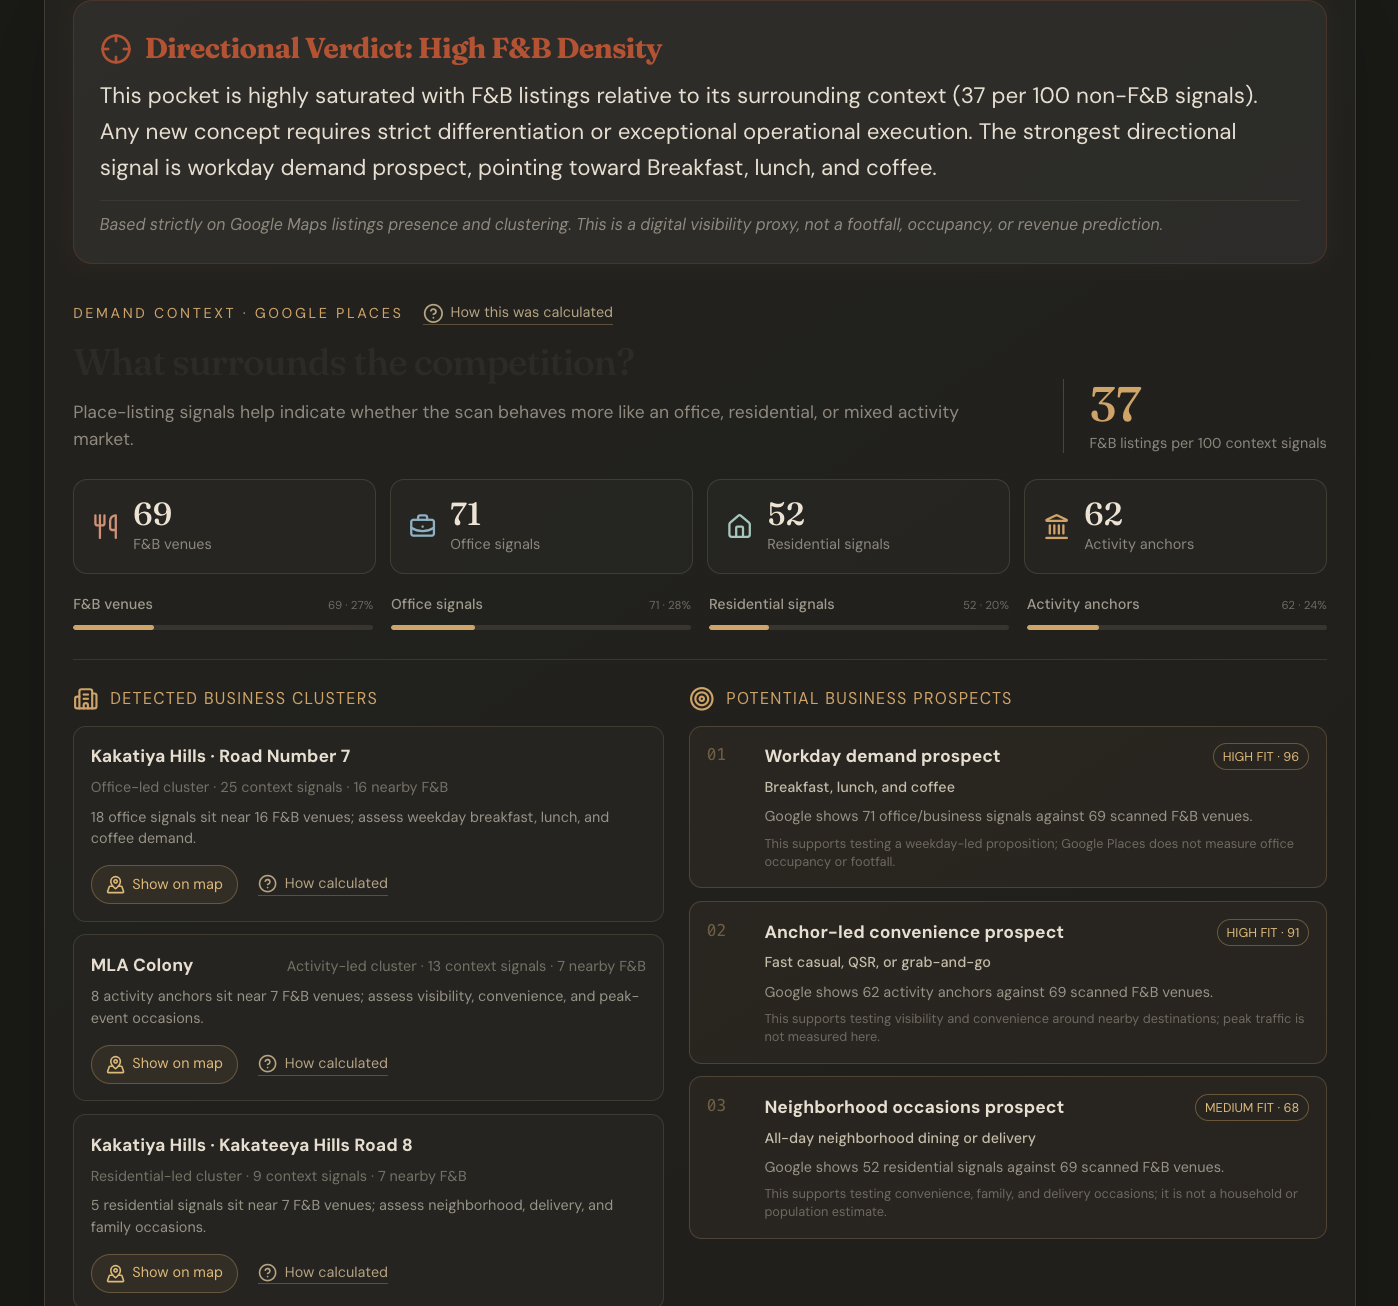
Four counts: F&B venues, office signals, residential signals, and activity anchors. The Kukatpally scan returns 94 venues against 83 office, 65 residential and 100 anchor listings.
Read these as texture, not census. They are counts of Google listings, so they describe what kind of area this is — office-leaning, residential, activity-driven — rather than how many people are in it. An area with 83 office listings is a weekday-lunch environment. That's a real signal. It is not a headcount.
The directional verdict
A stated position on the catchment, plus the map. The map shows the radius circle, the competitor points sized by review volume, and the cluster centres.
Look at the shape, not the count. Dense arcs mean the food demand on that stretch is already being served. Gaps inside the circle are worth a physical visit — sometimes they're an opportunity, and sometimes there's a reason nobody's there, like no parking or a compound wall.
Opportunity zones
Named clusters with their nearby supply and context mix. In Kukatpally, KPHB 5th Phase Road shows 6 office signals against only 4 F&B venues, while KPHB 6th Phase Road has 7 venues against 4 anchors.
The first is a thin-supply pocket next to weekday demand. That's the kind of read-through that turns into a site visit at 9am on a Tuesday to see who's actually queuing for breakfast.
The competitor table
The core of the report. Every venue with its category, rating, review count, competitive strength, and listing opportunity.
Strength combines the volume-adjusted rating with review count, distance from your point, and how complete the listing is. It answers: how hard is this venue to take share from?
Listing opportunity is separate and measures something different — how much of their Google profile is missing. A venue can be strong on the ground and still have an incomplete listing. Those are the ones worth studying, because a competitor who isn't maintaining their Google presence is leaving discovery on the table, and discovery is the one thing you can win from day one.
Read the top ten closely. Those are the venues a customer will actually choose between when they're deciding where to eat near you.
Price-level profile
Google's own price bands, with the coverage disclosed. In the Kukatpally scan, 75 of 94 venues expose a price level: 61 moderate, 14 budget.
These are broad profile labels, not menu prices. What they tell you is the shape of the market — a catchment that's overwhelmingly moderate with almost nothing at the premium end tells you where the crowd already is, and where it isn't. Test the actual price points on a site visit with a menu in your hand.
Methodology
Read it. It states how coverage was built, what the scores are and aren't, and what the context counts don't represent. If you're going to quote a number from this report to a landlord or an investor, know what's behind it first.
What this won't tell you
Rent. Access and parking. Kitchen exhaust feasibility. Whether the landlord is reasonable. Whether the anchor tenant next door is about to leave. Whether the area is on its way up or quietly declining. What your staffing costs will be. Whether your concept is any good.
Those still need site visits, conversations with people who trade on that street, and a unit economics model. What ChefScope does is get you to those conversations faster, with sharper questions, and with two or three sites already eliminated.
Run a scan on your area
Put in the locality you're considering and see what comes back. Most people find something in the first report they didn't know about their own street — a competitor they'd never noticed, a cluster in the wrong place, or a competitive set twice the size they'd assumed.
If you're weighing up multiple sites, run each one at the same radius and compare the reports side by side. It's the cheapest hour of diligence you'll do on a decision this size.